Service health
Storefront · production
Availability, telemetry and response activity in one service view.
Check history
Last 24 hours- Uptime
- 99.99%
- Latency
- 142 ms
- Objective
- On target
Illustrative interface with sample data.
Understand production · Monitoring
Uptime, heartbeat and queue checks, application telemetry and traces, and alerts that turn the signals that matter into incidents.
Storefront · production
Availability, telemetry and response activity in one service view.
Check history
Last 24 hoursIllustrative interface with sample data.
Understand production
HTTP, DNS, TLS and TCP checks, queue workers and cron heartbeats, with maintenance windows beside the history.
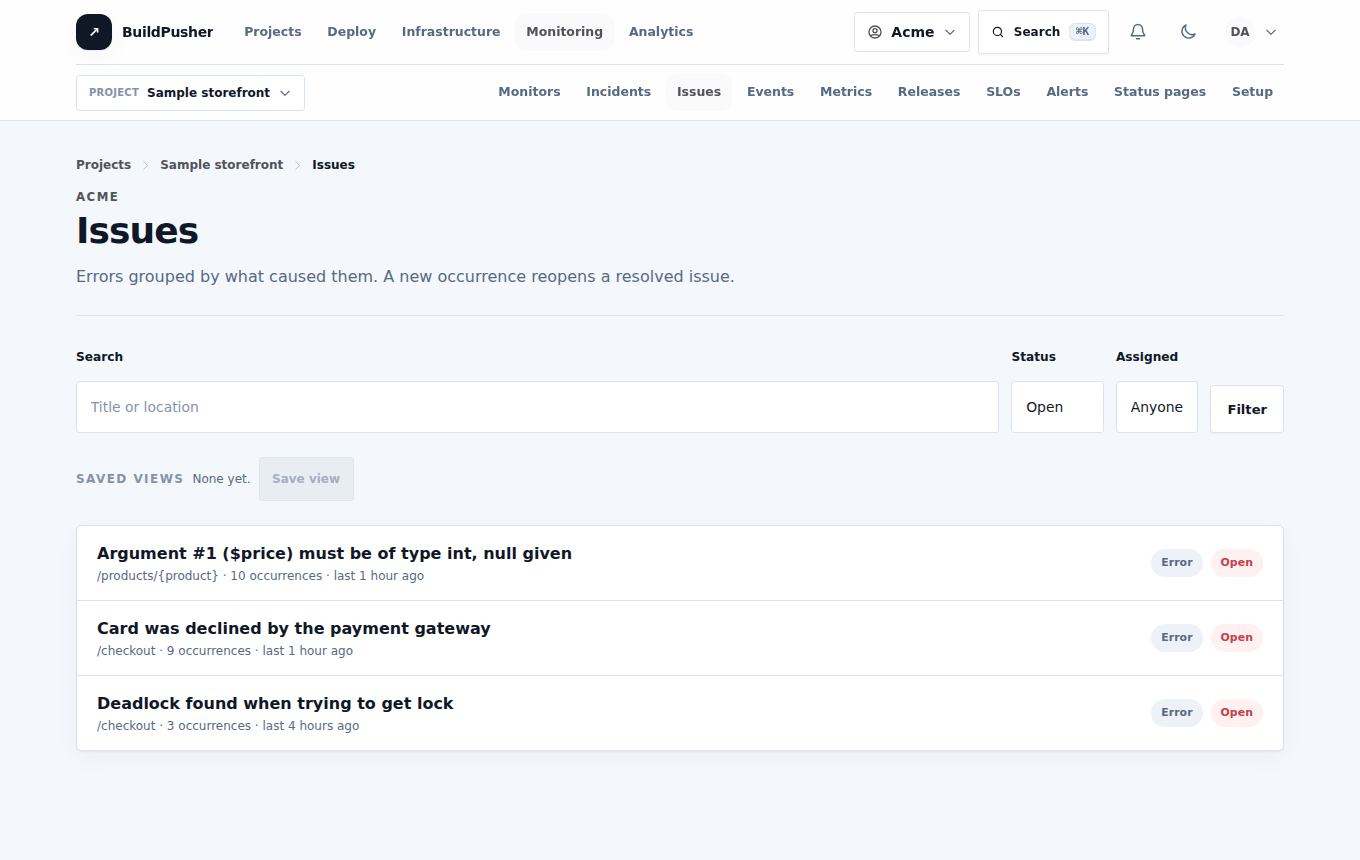
Traces, metrics, logs and grouped issues, each with the release it arrived in.
Route alerts, escalate, acknowledge, and publish updates to a status page.
Inside Monitoring
A closer look at what Monitoring does, grouped by the work it supports.
Checks
Scheduled checks with history, recovery and planned work in context.
Telemetry
The application signals that explain what users see.
Respond
Explicit alert conditions, routed notifications and a timeline for every incident.
A practical path through Monitoring
Put availability, telemetry and the team’s response into a practical sequence.
Create an application, add an ingestion key, and send telemetry or OpenTelemetry data.
Add checks and heartbeats, and record maintenance windows before planned work.
Route alerts to your team, work the incident timeline, and compare against your objectives.
Safety and accountability
Control how telemetry arrives, how alerts are routed, and who can see what happened.
Better together
Good to know
Scheduled HTTP, DNS, TLS and TCP checks, queue and heartbeat checks, and application errors, traces, logs and metrics, including OpenTelemetry.
Yes. Status pages publish the services you choose, with incident updates and email subscriptions.
No. Ingest, OpenTelemetry, heartbeat and queue endpoints keep their addresses and formats.
Part of BuildPusher
Every service has a free tier. Turn on the others when a project needs them, on the same account and bill.